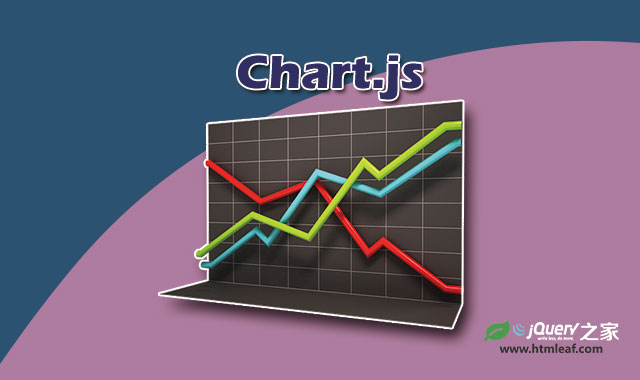

Chart.js是一款简单实用的基于HTML5 canvas的js图表插件。该js图表插件利用canvas的特性,动态生成各种类型的图表。图表类型有:柱状图、线性图、饼状图、环状图、极坐标图和雷达图。并可以自定义tooltips。
安装
使用该js图表插件首先要在页面中引入Chart.js文件,该文件会生成一个全局的变量Chart。
<script src="Chart.js"></script>
如果你使用AMD的javascript模式,也同样可以支持Chart.js的核心文件。注意:该负数同样会产生一个全局变量Chart,即使是删除了define和define.amd。如果你不希望这样,可以使用noConflict来保存全局变量。
// Using requirejs
require(['path/to/Chartjs'], function(Chart){
    // Use Chart.js as normal here.

    // Chart.noConflict restores the Chart global variable to it's previous owner
    // The function returns what was previously Chart, allowing you to reassign.
    var Chartjs = Chart.noConflict();

});
你还可以通过Bower来安装chart.js。
bower install Chart.js --save
使用方法
要创建一个图标,需要实例化一个Chart对象。要实例化一个Chart对象,可以通过创建一个带2D上下文的<canvas>元素来实现:
<canvas id="myChart" width="400" height="400"></canvas>
// Get the context of the canvas element we want to select
var ctx = document.getElementById("myChart").getContext("2d");
var myNewChart = new Chart(ctx).PolarArea(data);
也可以通过jQuery来获取<canvas>元素的上下文:
// Get context with jQuery - using jQuery's .get() method.
var ctx = $("#myChart").get(0).getContext("2d");
// This will get the first returned node in the jQuery collection.
var myNewChart = new Chart(ctx);
在创建Chart对象之后,就可以继续创建chart.js中存在的图表。下面是一个极坐标图的例子:
new Chart(ctx).PolarArea(data, options);
图表的插件是通过调用与图表名称相同的方法来实现。在方法中的data参数是图表的类型,options是图表的参数。Chart.js会将全局默认参数和指定的默认参数相合并,然后将传入的options作为第二个参数使用。
全局配置参数
Chart.defaults.global = {
    // Boolean - Whether to animate the chart
    animation: true,

    // Number - Number of animation steps
    animationSteps: 60,

    // String - Animation easing effect
    animationEasing: "easeOutQuart",

    // Boolean - If we should show the scale at all
    showScale: true,

    // Boolean - If we want to override with a hard coded scale
    scaleOverride: false,

    // ** Required if scaleOverride is true **
    // Number - The number of steps in a hard coded scale
    scaleSteps: null,
    // Number - The value jump in the hard coded scale
    scaleStepWidth: null,
    // Number - The scale starting value
    scaleStartValue: null,

    // String - Colour of the scale line
    scaleLineColor: "rgba(0,0,0,.1)",

    // Number - Pixel width of the scale line
    scaleLineWidth: 1,

    // Boolean - Whether to show labels on the scale
    scaleShowLabels: true,

    // Interpolated JS string - can access value
    scaleLabel: "<%=value%>",

    // Boolean - Whether the scale should stick to integers, not floats even if drawing space is there
    scaleIntegersOnly: true,

    // Boolean - Whether the scale should start at zero, or an order of magnitude down from the lowest value
    scaleBeginAtZero: false,

    // String - Scale label font declaration for the scale label
    scaleFontFamily: "'Helvetica Neue', 'Helvetica', 'Arial', sans-serif",

    // Number - Scale label font size in pixels
    scaleFontSize: 12,

    // String - Scale label font weight style
    scaleFontStyle: "normal",

    // String - Scale label font colour
    scaleFontColor: "#666",

    // Boolean - whether or not the chart should be responsive and resize when the browser does.
    responsive: false,

    // Boolean - whether to maintain the starting aspect ratio or not when responsive, if set to false, will take up entire container
    maintainAspectRatio: true,

    // Boolean - Determines whether to draw tooltips on the canvas or not
    showTooltips: true,

    // Function - Determines whether to execute the customTooltips function instead of drawing the built in tooltips (See [Advanced - External Tooltips](#advanced-usage-custom-tooltips))
    customTooltips: false,

    // Array - Array of string names to attach tooltip events
    tooltipEvents: ["mousemove", "touchstart", "touchmove"],

    // String - Tooltip background colour
    tooltipFillColor: "rgba(0,0,0,0.8)",

    // String - Tooltip label font declaration for the scale label
    tooltipFontFamily: "'Helvetica Neue', 'Helvetica', 'Arial', sans-serif",

    // Number - Tooltip label font size in pixels
    tooltipFontSize: 14,

    // String - Tooltip font weight style
    tooltipFontStyle: "normal",

    // String - Tooltip label font colour
    tooltipFontColor: "#fff",

    // String - Tooltip title font declaration for the scale label
    tooltipTitleFontFamily: "'Helvetica Neue', 'Helvetica', 'Arial', sans-serif",

    // Number - Tooltip title font size in pixels
    tooltipTitleFontSize: 14,

    // String - Tooltip title font weight style
    tooltipTitleFontStyle: "bold",

    // String - Tooltip title font colour
    tooltipTitleFontColor: "#fff",

    // Number - pixel width of padding around tooltip text
    tooltipYPadding: 6,

    // Number - pixel width of padding around tooltip text
    tooltipXPadding: 6,

    // Number - Size of the caret on the tooltip
    tooltipCaretSize: 8,

    // Number - Pixel radius of the tooltip border
    tooltipCornerRadius: 6,

    // Number - Pixel offset from point x to tooltip edge
    tooltipXOffset: 10,

    // String - Template string for single tooltips
    tooltipTemplate: "<%if (label){%><%=label%>: <%}%><%= value %>",

    // String - Template string for multiple tooltips
    multiTooltipTemplate: "<%= value %>",

    // Function - Will fire on animation progression.
    onAnimationProgress: function(){},

    // Function - Will fire on animation completion.
    onAnimationComplete: function(){}
}
如果你希望图表是响应式的,可以参考下面的设置:
Chart.defaults.global.responsive = true;
现在,每次创建图表的时候,options.responsive都会被设置为true。
每一种图表类型的详细参数和使用方法,请点击下面的链接查看。
Chart.js在线文档